

Services & Monitors
Services and their monitors are at the heart of Monitoring. A Service is a logical unit — “my-website”, “checkout”, or even “my-entire-saas”. A Monitor is one concrete check against exactly one target: ping the landing page, connect to the database port, verify the TLS certificate hasn’t expired. Each service contains one or more monitors, and the service’s status rolls up from them.
flowchart TD
    S["Service: Web Shop"] --> M1["Monitor: HTTP https://shop.example.com"]
    S --> M2["Monitor: SSL certificate shop.example.com"]
    S --> M3["Monitor: Heartbeat nightly-backup"]
    M1 --> L1["🇩🇪 Nuremberg"]
    M1 --> L2["🇺🇸 Hillsboro"]
    M1 --> L3["🇸🇬 Singapore"]
Manage everything under Monitoring → Services in your Project.
Statuses
Section titled “Statuses”Services and monitors share one status vocabulary:
| Status | Meaning |
|---|---|
| Operational | All checks pass. |
| Degraded | Checks pass, but slower than the degraded threshold. |
| Partial Outage | Some monitors of a service are down while others are up. |
| Major Outage | A check fails outright (error, unexpected result, or timeout) — or all monitors of a service are down. |
| Maintenance | An active maintenance window — overrides everything else. |
| Paused | The monitor or its service is paused. |
| No Data | The checking infrastructure returned no result within 60 seconds. |
| Unknown | No check has completed yet (e.g. right after creation or resume). |
How a monitor gets its status: every selected location checks independently. A location that fails reports an outage; a location that succeeds but responds slower than the degraded threshold reports Degraded. Any single location confirming an outage flips the whole monitor — there is no majority vote. “Confirming” means the new state was seen for failure-threshold consecutive checks (the very first check after Unknown flips immediately). Degraded never outranks an outage.
How a service gets its status: paused → Paused; in maintenance → Maintenance. Otherwise: all monitors up → Operational; all down → Major Outage; a mix of up and down → Partial Outage; only up and degraded → Degraded. A degraded monitor alone never escalates the service past Degraded.
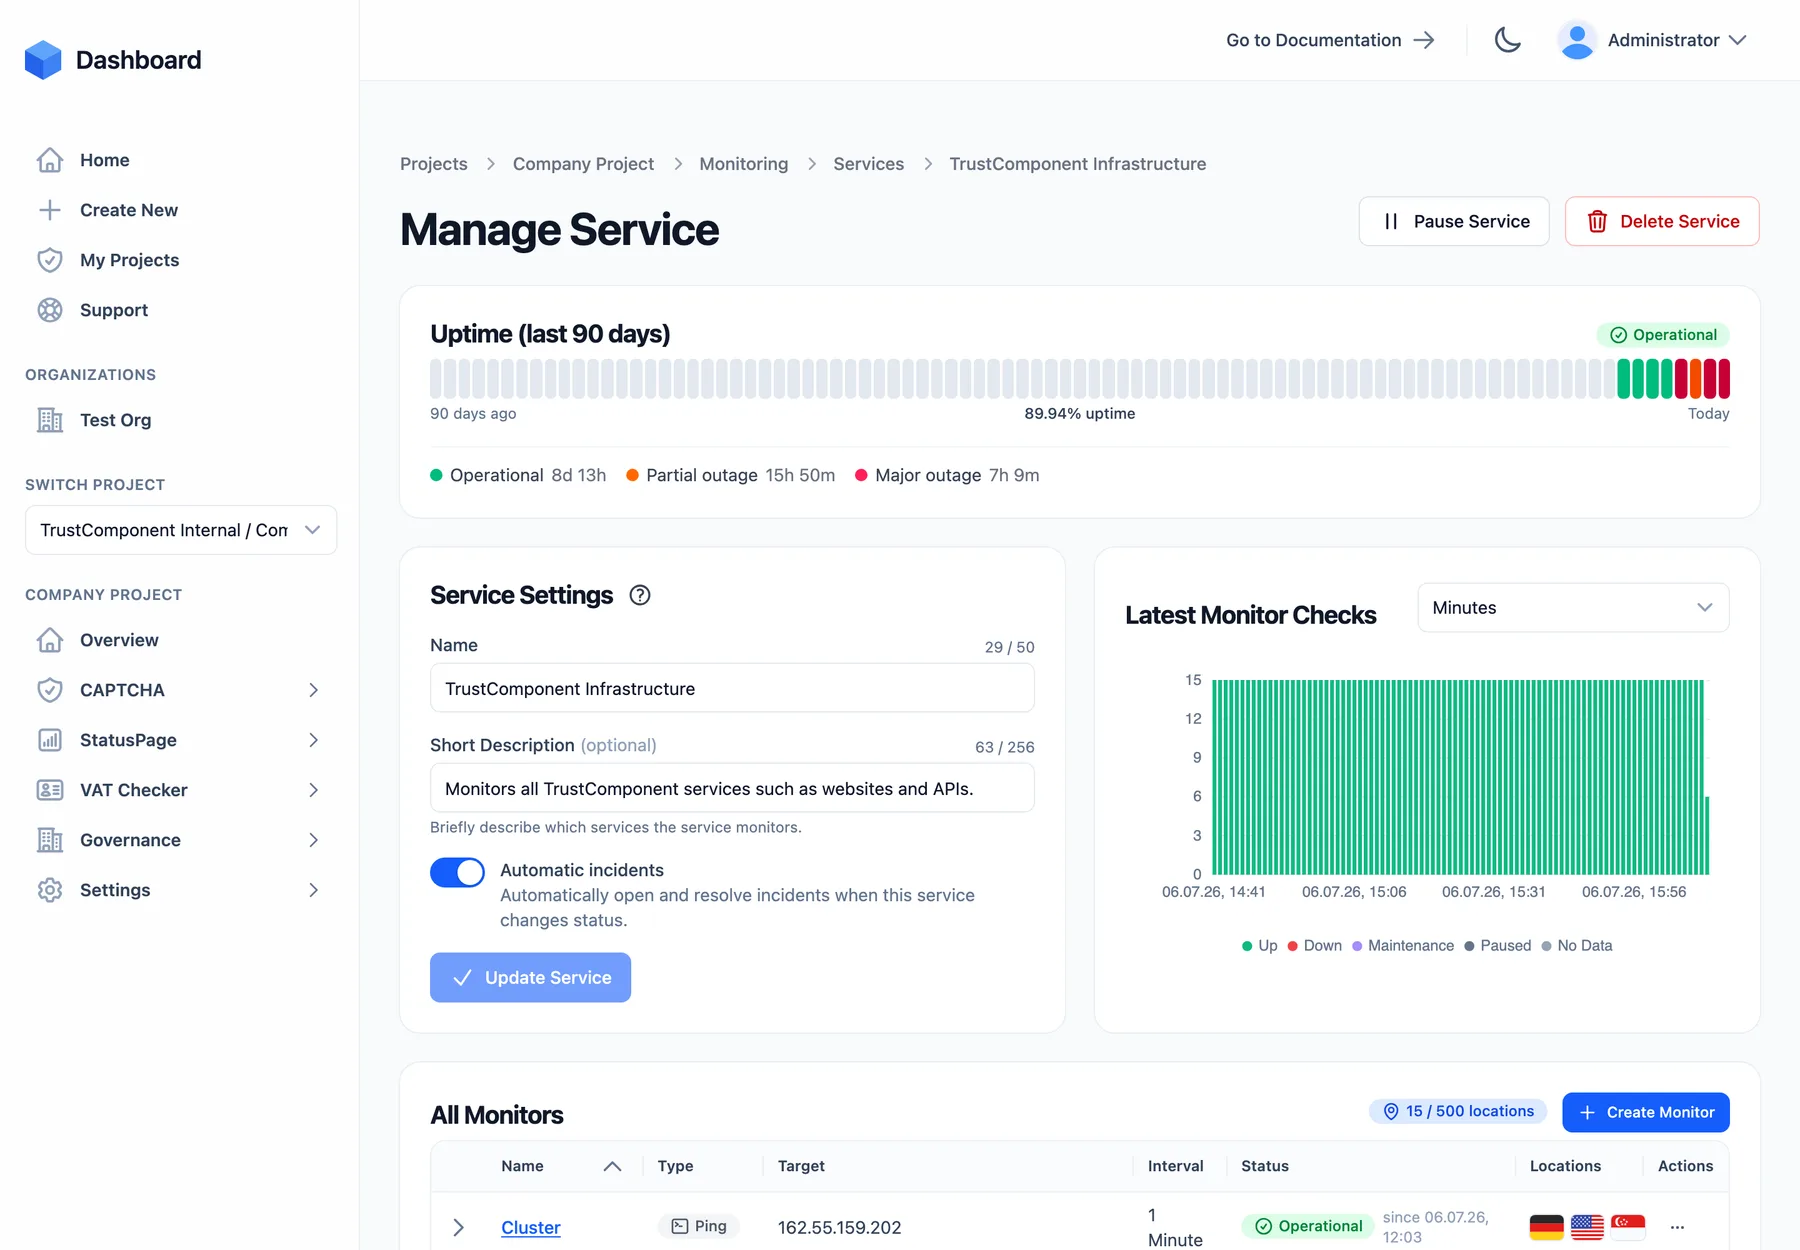
Managing services
Section titled “Managing services”Create a service with Create Service:
| Field | Required | Constraints |
|---|---|---|
| Name | Yes | 3–50 characters, e.g. My-Website |
| Short description | No | Max. 256 characters — shown on status pages when enabled |
After creating the service, add monitors to it. On the service’s detail page you also configure alert rules and maintenance windows.
Further service actions (row menu or detail page):
- Pause / Start — a paused service stops all its checks and shows Paused. Monitors you paused individually stay paused when the service resumes. Status-page subscribers can be notified of pause/resume.
- Duplicate — pre-fills the create dialog with
<name> (Copy). - Automatic incidents — when enabled (plan feature), an incident draft is opened automatically when the service enters Partial Outage or Major Outage. Drafts that stay untouched are cleaned up after 48 hours.
- Delete — permanently removes the service and all its monitors, alert rules, and history. You must type the service name to confirm.
Creating a monitor
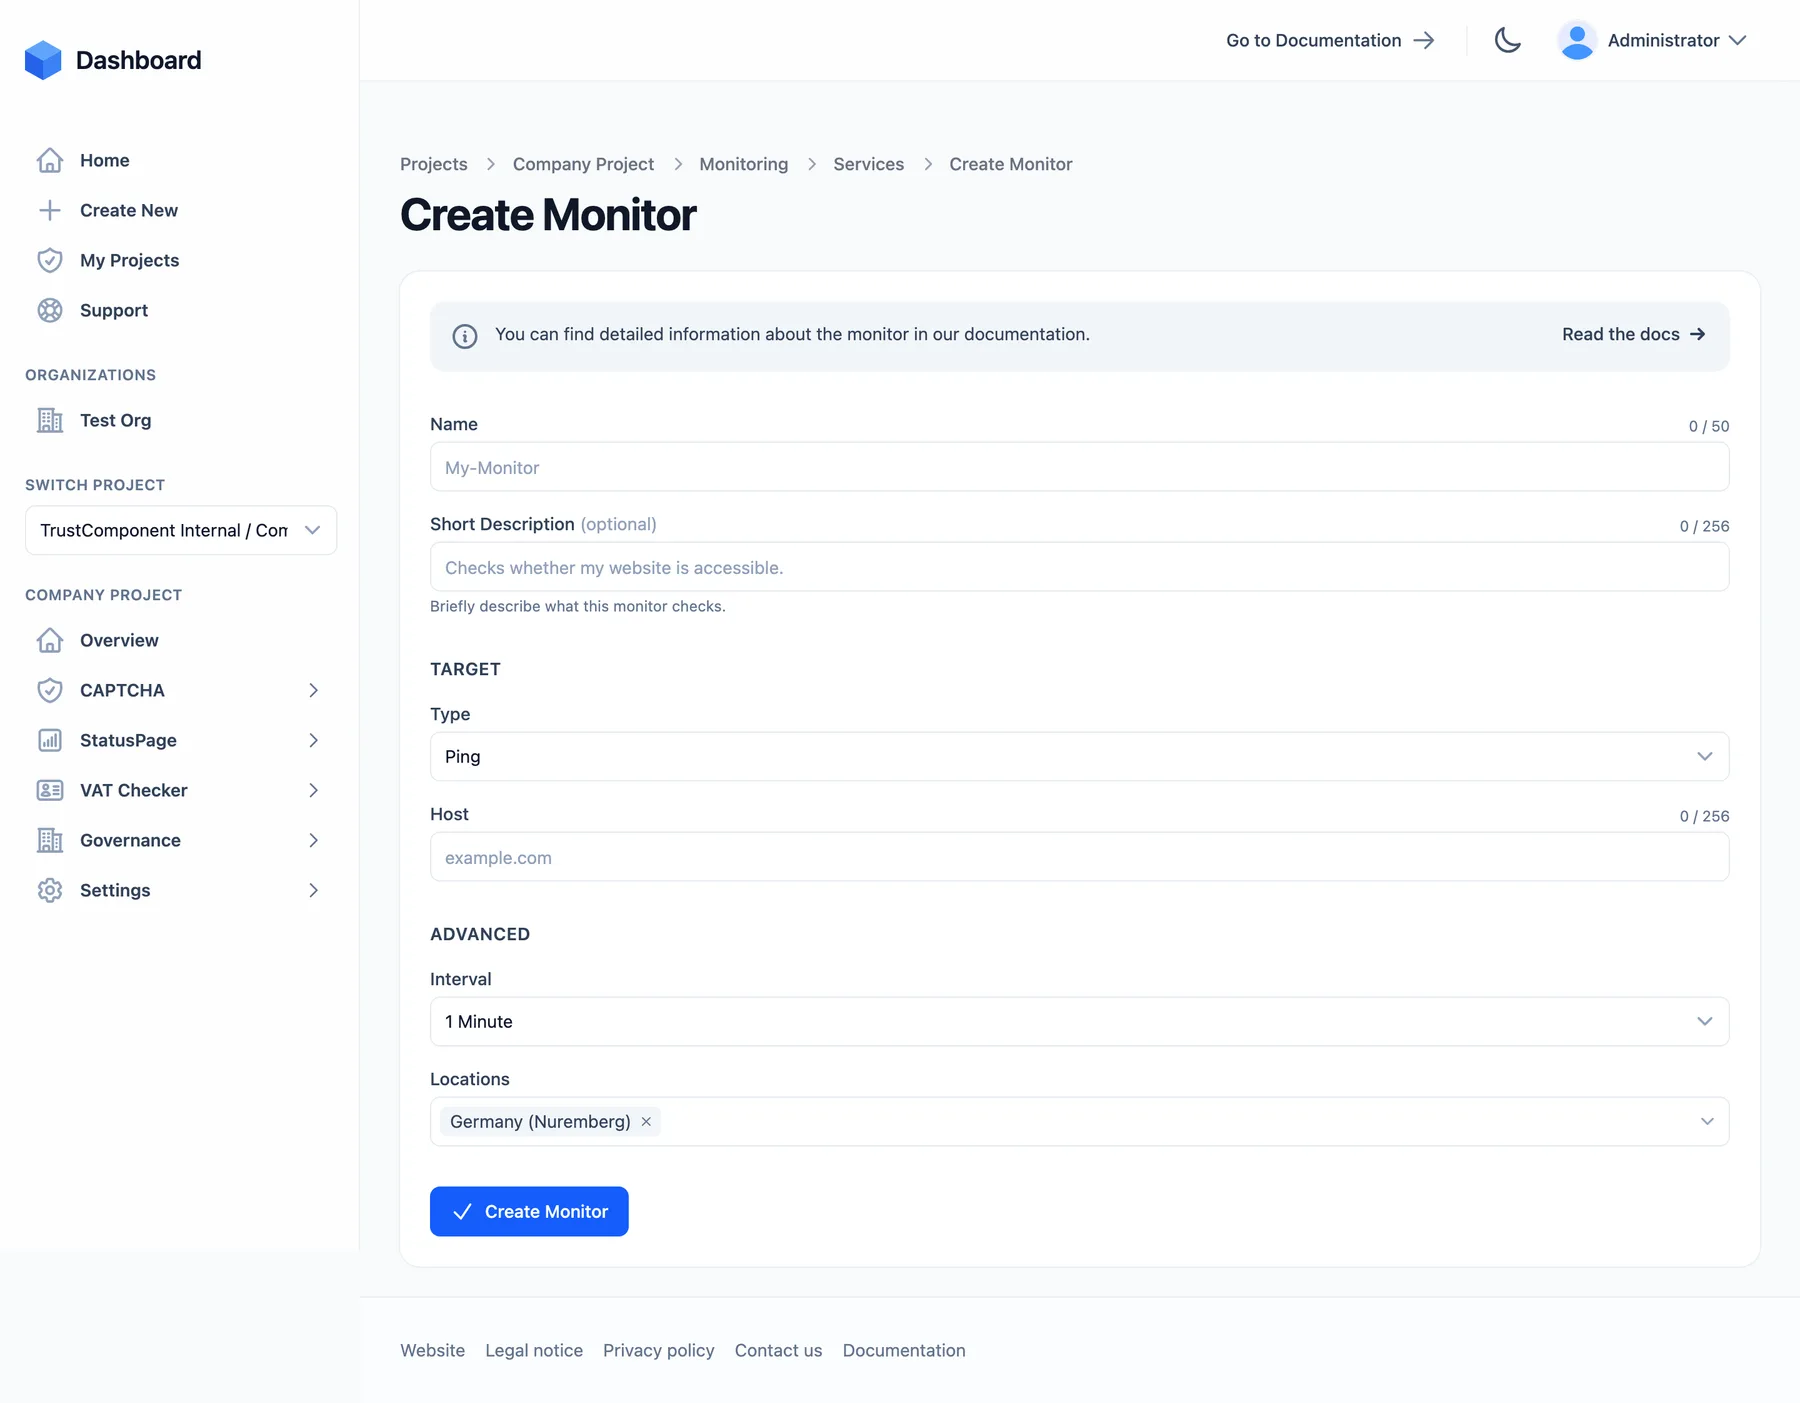
Section titled “Creating a monitor”Open a service and click Create Monitor. Every monitor has:
| Field | Required | Constraints |
|---|---|---|
| Name | Yes | 3–50 characters |
| Short description | No | Max. 256 characters |
| Type | Yes | One of the 16 check types — cannot be changed later |
| Target settings | Per type | See the per-type reference |
| Interval | Yes | See check interval |
| Locations | Yes | See locations |
Timeout, degraded threshold, and failure threshold are not part of the create form — each type starts with sensible defaults, which you can tune afterwards on the monitor’s edit page (see Advanced settings).
Check interval
Section titled “Check interval”The interval controls how often the check runs. Available steps: 15 s, 30 s, 1 min, 5 min, 10 min, 15 min, 30 min, 60 min, 1 day.
Two minimums apply — a technical one per check type (see the summary table) and one from your plan. If you request an interval below the effective minimum, it is silently raised, never rejected.
The interval also sets the default failure threshold (how many consecutive failed checks before a monitor flips — see Advanced settings):
| Interval | 15 s | 30 s | 1 min | 5 min | 10 min | 15 min | 30 min | 60 min | 1 day |
|---|---|---|---|---|---|---|---|---|---|
| Default failure threshold | 5 | 4 | 3 | 3 | 2 | 2 | 2 | 1 | 1 |
Fast intervals get a higher default threshold so a single network blip doesn’t page you; slow intervals alert on the first failure because waiting for confirmation would take too long.
Locations
Section titled “Locations”Active checks can run from up to three locations:
- 🇩🇪 Germany (Nuremberg) — the default
- 🇺🇸 United States (Hillsboro)
- 🇸🇬 Singapore
How multi-location checking behaves:
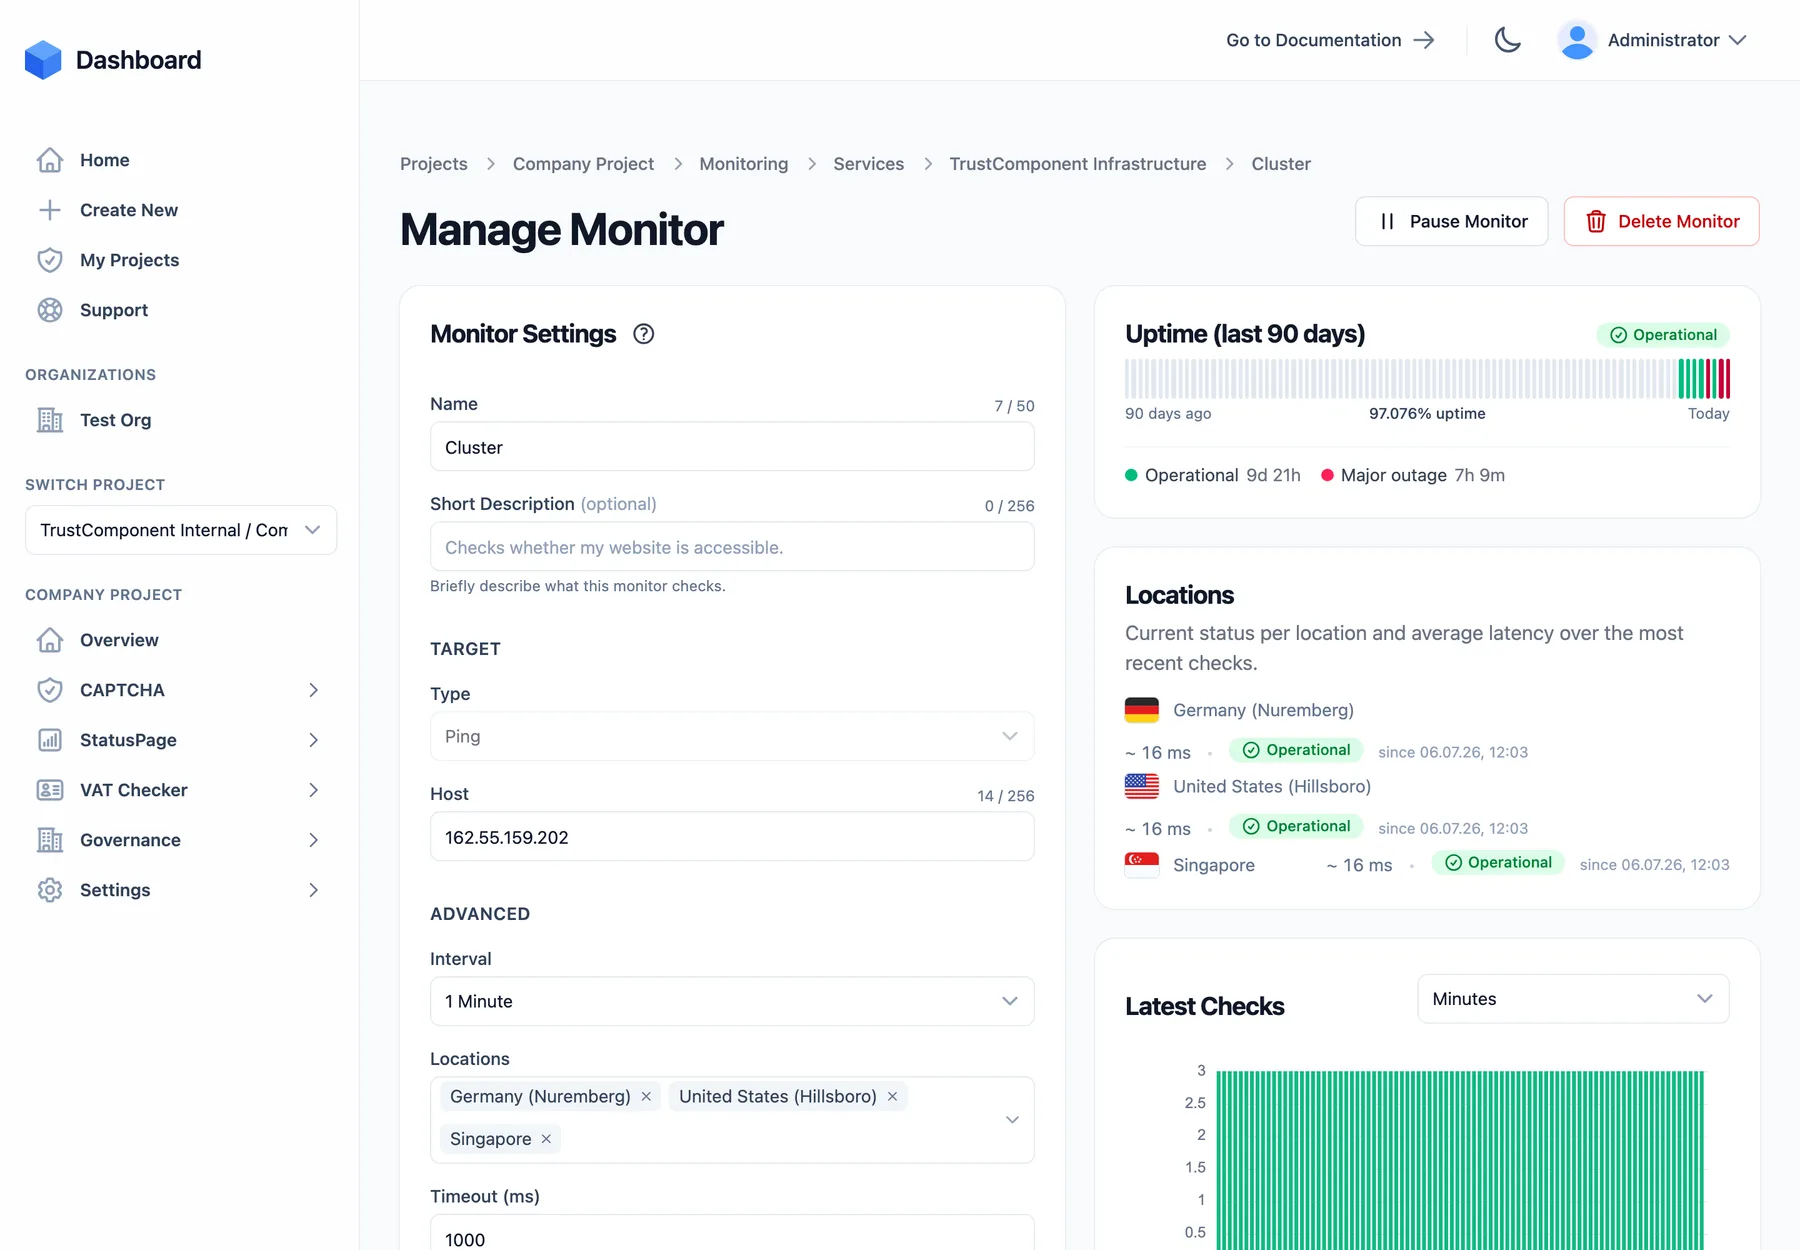
- Each location checks independently on every cycle and keeps its own status, latency stats, and error message (visible when you expand the monitor row).
- Any one location confirming an outage flips the monitor — there is no majority vote. This catches regional problems (e.g. your site is unreachable from Asia only).
- Some types always run from Nuremberg only: DNS, SSL Certificate, Domain, DNSBL, Heartbeat (heartbeat is passive and has no location at all).
- Selecting locations other than Germany requires the Global locations plan feature.
Advanced settings
Section titled “Advanced settings”On the monitor’s edit page (plan feature Advanced monitor settings; without it, the defaults apply):
| Setting | Range | Default | Meaning |
|---|---|---|---|
| Timeout (ms) | 1,000 – 30,000 | per type, see table | Maximum time a check may take before it counts as down. |
| Degraded threshold (ms) | 1 – 120,000 | per type, see table | A successful check slower than this reports Degraded instead of Operational. Values above the timeout can never fire — they are capped at the timeout. |
| Failure threshold | 1 – 10 | per interval | How many consecutive failed checks (per location) before the monitor switches to down. Protects against flapping. |
Timeout and degraded threshold only exist for latency-measuring types — Domain and Heartbeat monitors have neither.
Monitor lifecycle
Section titled “Monitor lifecycle”- Pause / Start — pausing stops checks; the timeline records Paused data points, so statistics have no gaps. Resuming resets the status to Unknown and triggers a check immediately.
- Duplicate — pre-fills the create form with all settings of the original (
<name> (Copy)). - Edit — everything except the type can change. Changing a heartbeat monitor keeps its token and last-ping time.
- Delete — permanently removes the monitor and its entire history (uptime, state changes, raw checks).
Check types
Section titled “Check types”| Type | What it checks | Min. interval | Locations | Default timeout | Default degraded threshold |
|---|---|---|---|---|---|
| Ping | ICMP reachability | 15 s | multi | 1,000 ms | 300 ms |
| TCP | Port accepts connections | 15 s | multi | 3,000 ms | 500 ms |
| HTTP | Status, headers, body, JSON | 15 s | multi | 10,000 ms | 1,500 ms |
| Keyword Check | Substring on a page | 15 s | multi | 10,000 ms | 3,000 ms |
| UDP | Datagram send / response | 15 s | multi | 5,000 ms | 500 ms |
| Heartbeat | Your system pings us | 15 s | passive | — | — |
| DNS | Record lookup | 1 min | 🇩🇪 only | 5,000 ms | 400 ms |
| SSL Certificate Validation | Certificate expiry | 1 min | 🇩🇪 only | 10,000 ms | 8,000 ms |
| SMTP | Mail-server banner | 1 min | multi | 5,000 ms | 1,500 ms |
| IMAP | Mail-server banner | 1 min | multi | 5,000 ms | 1,500 ms |
| POP3 | Mail-server banner | 1 min | multi | 5,000 ms | 1,500 ms |
| SSH | SSH banner | 1 min | multi | 5,000 ms | 1,500 ms |
| FTP | FTP banner | 1 min | multi | 5,000 ms | 1,500 ms |
| NTP | Time-server response | 1 min | multi | 5,000 ms | 500 ms |
| DNS Blacklist (DNSBL) | IP on block lists | 15 min | 🇩🇪 only | 5,000 ms | 800 ms |
| Domain Validation | Registration expiry | 1 day (fixed) | 🇩🇪 only | — | — |
Which types are available depends on your plan. All timeouts and degraded thresholds are tunable within the advanced-settings ranges.
Sends an ICMP echo request to a host — the classic “is the machine reachable at all” check. Best as a first-line check for servers and network gear.
| Setting | Required | Default | Notes |
|---|---|---|---|
| Host | Yes | — | Domain or IP address, e.g. example.com |
Up = host answers within the timeout (default 1,000 ms). Degraded = answer slower than 300 ms (default). Down = no answer or error.
Opens a TCP connection to a host and port. Confirms a service is listening without speaking its protocol — databases, message brokers, game servers, anything with a port.
| Setting | Required | Default | Notes |
|---|---|---|---|
| Host | Yes | — | Domain or IP address |
| Port | Yes | 443 | 1 – 65535 |
Up = connection established within the timeout (default 3,000 ms). Down = refused, unreachable, or timed out.
Requests a URL and asserts on the response — the workhorse for websites and APIs. Beyond the status code you can check headers, request bodies, response content, and a JSON value.
| Setting | Required | Default | Notes |
|---|---|---|---|
| URL | Yes | — | Full URL incl. scheme, e.g. https://www.example.com/page |
| HTTP method | Yes | GET | GET, POST, PUT, DELETE |
| Expected statuses | Yes | — | Comma-separated accepted status codes, e.g. 200,201,204 |
| Headers | No | — | Comma-separated key=value pairs, e.g. Authorization=Bearer xxx,Accept=application/json |
| Body | No | — | Request body (for POST/PUT) |
| Body contains | No | — | Substring that must appear in the response body |
| Body does not contain | No | — | Substring that must not appear in the response body |
| JSON path | No | — | Path evaluated against the response body, e.g. $.status |
| JSON expected value | No | — | Expected value at the JSON path |
Up = status code matches and every configured body/JSON assertion passes. Any failed assertion is down, with a precise error message per location (e.g. unexpected status 503).
Resolves a record for a host against a DNS server of your choice and compares the answer. Catches broken zone changes, expired records, and hijacked entries.
| Setting | Required | Default | Notes |
|---|---|---|---|
| Host | Yes | — | The name to resolve |
| Record type | Yes | A | A, AAAA, CNAME, MX, TXT, NS |
| Expected records | Yes | — | Comma-separated, e.g. 1.2.3.4, 5.6.7.8 — all listed records must be present in the answer |
| DNS server | Yes | — | Resolver IP to query, e.g. 8.8.8.8 |
Up = all expected records found. Runs from Nuremberg only.
SSL Certificate Validation
Section titled “SSL Certificate Validation”Performs a TLS handshake (with SNI) and reads the certificate’s expiry date. Alerts you before the certificate runs out — not when it already has.
| Setting | Required | Default | Notes |
|---|---|---|---|
| Host | Yes | — | Domain presenting the certificate |
| Port | Yes | 443 | 1 – 65535 |
| Min. days until expiry | Yes | 14 | 1 – 365 — down when the certificate expires within fewer days |
Down also fires when the handshake itself fails (e.g. broken chain). Runs from Nuremberg only.
Domain Validation
Section titled “Domain Validation”Checks your domain’s registration expiry via RDAP (with WHOIS fallback). The counterpart to the certificate check — an expired domain takes everything down with it.
| Setting | Required | Default | Notes |
|---|---|---|---|
| Domain | Yes | — | Registered domain, e.g. example.com |
| Min. days until expiry | Yes | 14 | 1 – 365 |
Runs once per day (fixed), from Nuremberg, with no timeout/latency settings.
Heartbeat
Section titled “Heartbeat”Passive: instead of TrustComponent reaching out, your system pings us — perfect for cron jobs, queue workers, and backup scripts that have no port to probe. If no ping arrives within interval + grace period, the monitor goes down.
| Setting | Required | Default | Notes |
|---|---|---|---|
| Grace period (seconds) | Yes | 300 | 10 – 86,400 — extra tolerance after the expected ping before flipping to down |
After creation the monitor shows its secret token (prefixed hbt_) — ping the endpoint with it or with a Project API key; see the Heartbeat API for the exact URLs. If the token leaks, rotate it on the monitor page (the old token stops working immediately). A ping from a down state flips the monitor back to Operational instantly — recovery doesn’t wait for the next evaluation cycle.
Keyword Check
Section titled “Keyword Check”Fetches a URL and verifies a substring appears in the response body. Simpler than a full HTTP monitor when “the page still says what it should” is all you need.
| Setting | Required | Default | Notes |
|---|---|---|---|
| URL | Yes | — | e.g. https://www.example.com/status |
| Keyword | Yes | — | Substring that must appear in the response body |
| Headers | No | — | Comma-separated key=value pairs |
Up = response is 2xx and contains the keyword.
Connects to a mail server and reads its greeting banner.
| Setting | Required | Default | Notes |
|---|---|---|---|
| Host | Yes | — | Mail server |
| Port | Yes | 25 | Use 465 with TLS for SMTPS |
| Expected banner | No | 220 | Substring expected at the start of the banner; pre-filled with the protocol default, clear it to accept any banner |
| Use TLS | No | off | Wraps the connection in implicit TLS (SMTPS 465) |
Same banner check for IMAP servers.
| Setting | Required | Default | Notes |
|---|---|---|---|
| Host | Yes | — | |
| Port | Yes | 143 | Use 993 with TLS for IMAPS |
| Expected banner | No | * OK | |
| Use TLS | No | off | IMAPS 993 |
Same banner check for POP3 servers.
| Setting | Required | Default | Notes |
|---|---|---|---|
| Host | Yes | — | |
| Port | Yes | 110 | Use 995 with TLS for POP3S |
| Expected banner | No | +OK | |
| Use TLS | No | off | POP3S 995 |
Checks that an SSH daemon answers with its version banner — no login, no key exchange beyond the greeting.
| Setting | Required | Default | Notes |
|---|---|---|---|
| Host | Yes | — | |
| Port | Yes | 22 | |
| Expected banner | No | SSH- | |
| Use TLS | No | off | Rarely needed for SSH |
Banner check for FTP servers.
| Setting | Required | Default | Notes |
|---|---|---|---|
| Host | Yes | — | |
| Port | Yes | 21 | Use 990 with TLS for FTPS |
| Expected banner | No | 220 | |
| Use TLS | No | off | FTPS 990 |
Sends an NTP client packet and expects a valid server response — verifies your time source actually serves time.
| Setting | Required | Default | Notes |
|---|---|---|---|
| Host | Yes | — | Time server, e.g. pool.ntp.org |
| Port | Yes | 123 |
Sends a datagram to a host and port, optionally with a payload, optionally expecting an answer. For custom UDP protocols.
| Setting | Required | Default | Notes |
|---|---|---|---|
| Host | Yes | — | |
| Port | Yes | — | 1 – 65535 |
| Payload (hex) | No | — | Hex-encoded payload to send, e.g. a1b2c3 |
| Expect response | No | off | If enabled, up requires any UDP response before the timeout; if disabled, only the send is verified (UDP is connectionless — best effort) |
DNS Blacklist (DNSBL)
Section titled “DNS Blacklist (DNSBL)”Checks whether an IP address is listed on DNS block lists — essential for mail servers, where a listing silently kills deliverability.
| Setting | Required | Default | Notes |
|---|---|---|---|
| IP address | Yes | — | IPv4 address to check, e.g. 203.0.113.10 |
| Zones | Yes | — | Comma-separated blacklist zones, e.g. zen.spamhaus.org, b.barracudacentral.org |
All zones are queried in parallel. Up = listed on zero zones; a listing reports down with the zone name(s). Runs every 15+ minutes from Nuremberg.
Maintenance windows
Section titled “Maintenance windows”A maintenance window marks a planned period in which a service is expected to be unavailable. While a window is active:
- the service (and its monitors) shows Maintenance — on the dashboard and on status pages,
- all alerts are suppressed and any firing alert rule is reset,
- no checks are dispatched; the timeline records Maintenance instead, so your uptime statistics aren’t polluted by planned downtime,
- status-page subscribers receive maintenance started / ended notifications (if they opted in).
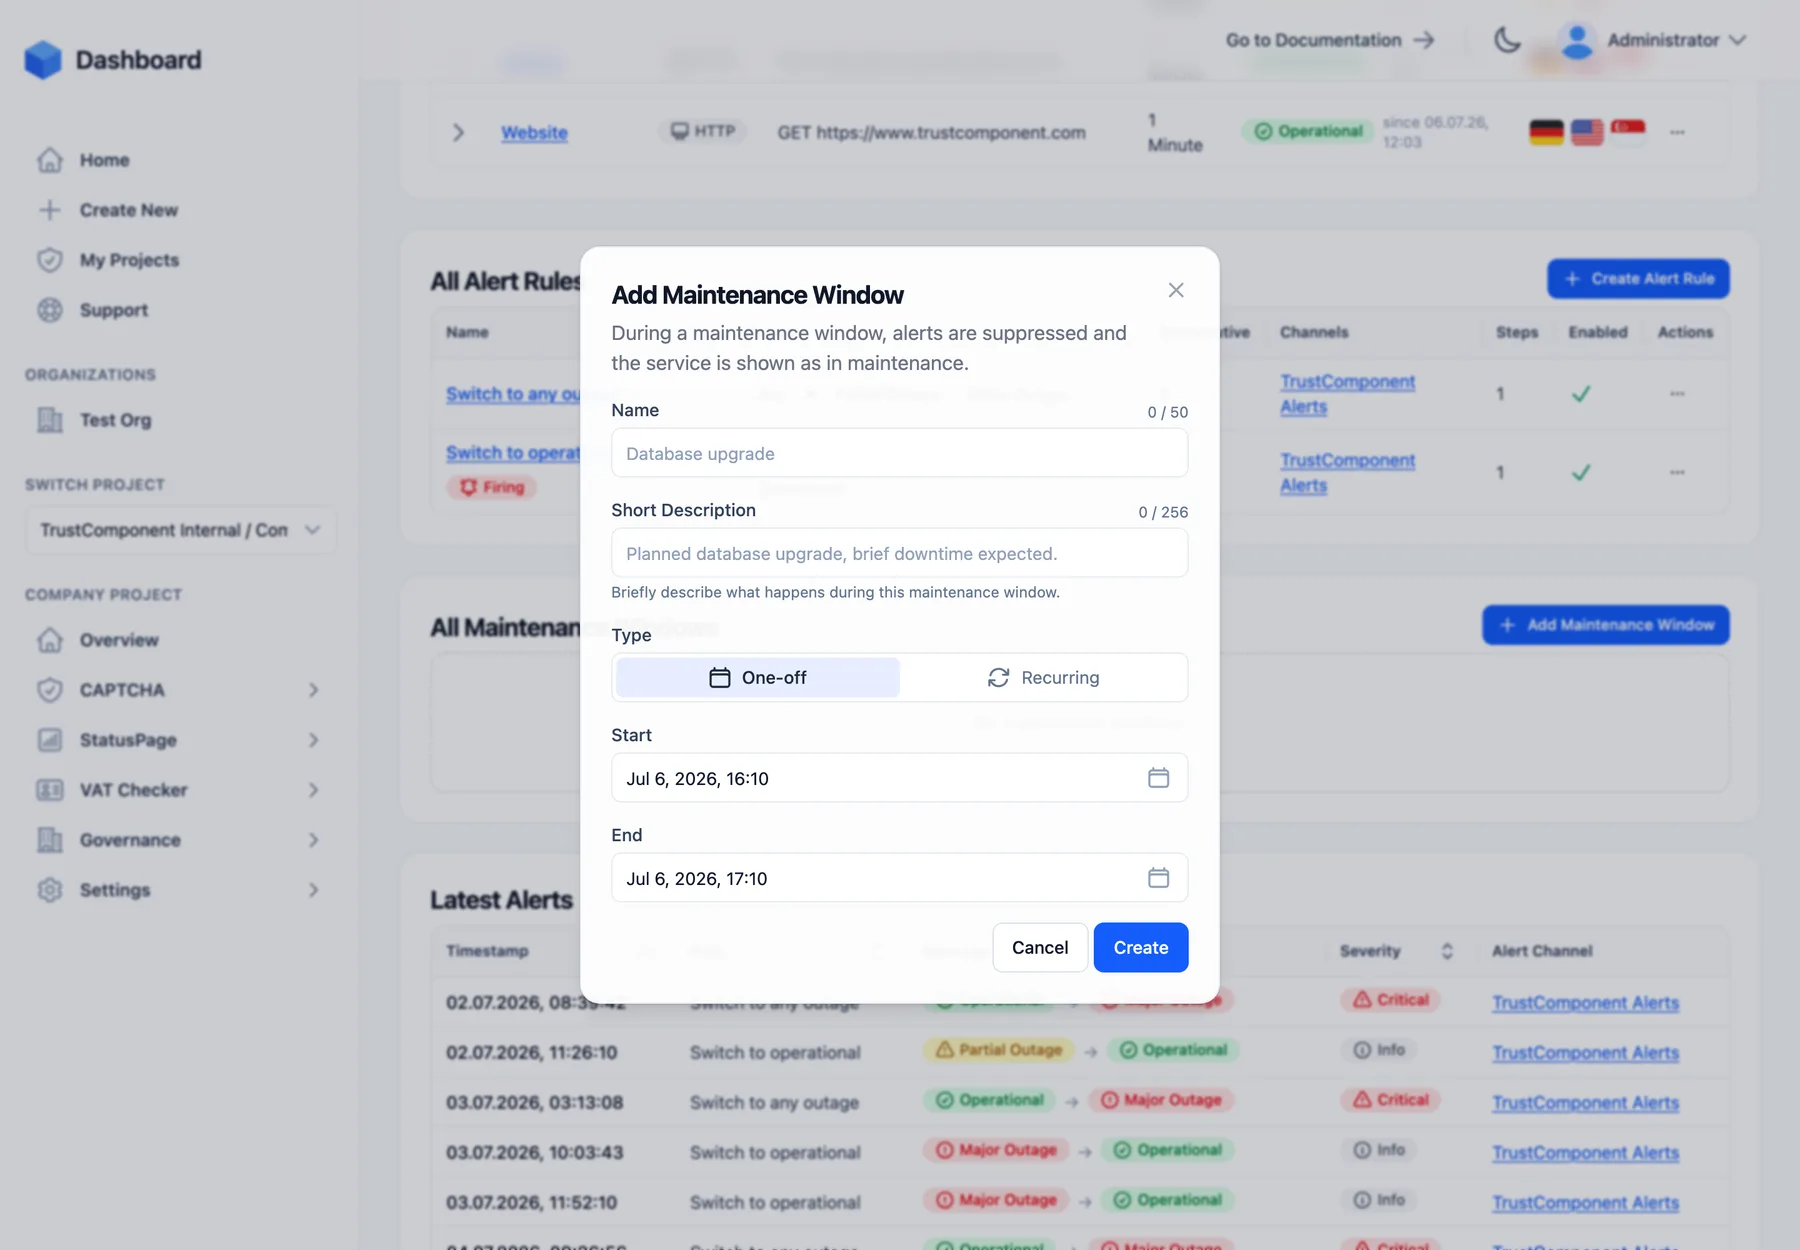
Add windows on the service detail page under All Maintenance Windows → Add Maintenance Window:
| Field | Required | Constraints |
|---|---|---|
| Name | Yes | 3–50 characters, e.g. Database upgrade |
| Short description | No | Max. 256 characters |
| Type | Yes | One-off or Recurring — fixed after creation |
| Start / End | One-off | Date-time pickers; end must be after start |
| Schedule (cron) | Recurring | Spring 6-field cron expression, interpreted in UTC, e.g. 0 0 3 * * SUN (every Sunday 03:00 UTC) |
| Duration (minutes) | Recurring | 1 – 10,080 (one week), default 60 |
Behavior and management:
- Enable / Disable — windows can be deactivated without deleting them (toggle in the edit dialog or the row menu). A disabled window never becomes active.
- Overlap is fine — the service is in maintenance while any enabled window is active.
- Active badge — currently running windows are marked Active in the table.
- Expired windows — one-off windows whose end has passed move to a separate Expired Maintenance Windows list; they no longer run but can still be edited (rescheduled) or deleted.
- Duplicate / Edit / Delete — via the row menu. Editing lets you rename, reschedule, and toggle Enabled; the type itself can’t change.
Planned maintenance you want to announce to customers (with updates and a timeline) is a separate concept — create a Scheduled Maintenance incident for that. Maintenance windows silence monitoring; incidents communicate.
Uptime, history & data retention
Section titled “Uptime, history & data retention”- Uptime bars — every service and monitor page shows the last 90 days as one bar per day, colored by the worst state that day; hover for the exact per-state durations, uptime percentage, and any incidents of that day.
- Per-location statistics — for each location you see the current status, the average latency of the most recent checks, and the last error message, on the expandable monitor rows and the monitor page.
- Latest checks charts — check outcomes (up/down/maintenance/paused/no data) and a latency line chart with your degraded threshold drawn in, switchable between 1-minute, 5-minute, hourly, and daily resolution.
- Retention — how far back history reaches depends on your plan’s data-retention feature (3–24 months). Raw per-check data is kept for 24 hours and rolled up into 1-minute → 5-minute → hourly → daily aggregates.
Limits
Section titled “Limits”Technical hard limits (independent of plan):
| Limit | Value |
|---|---|
| Services per Project | 1,000 |
| Monitors per service | 500 |
| Alert rules per service | 100 |
| Notification steps per alert rule | 20 |
| Maintenance windows per service | 100 |
Plan-dependent: total monitor locations (the quota the badge on the Services page tracks), available check types, minimum interval (down to 15/30 s), global locations, advanced settings, and maintenance windows. See Plans and usage for how plans work and how to upgrade.

