Monitoring
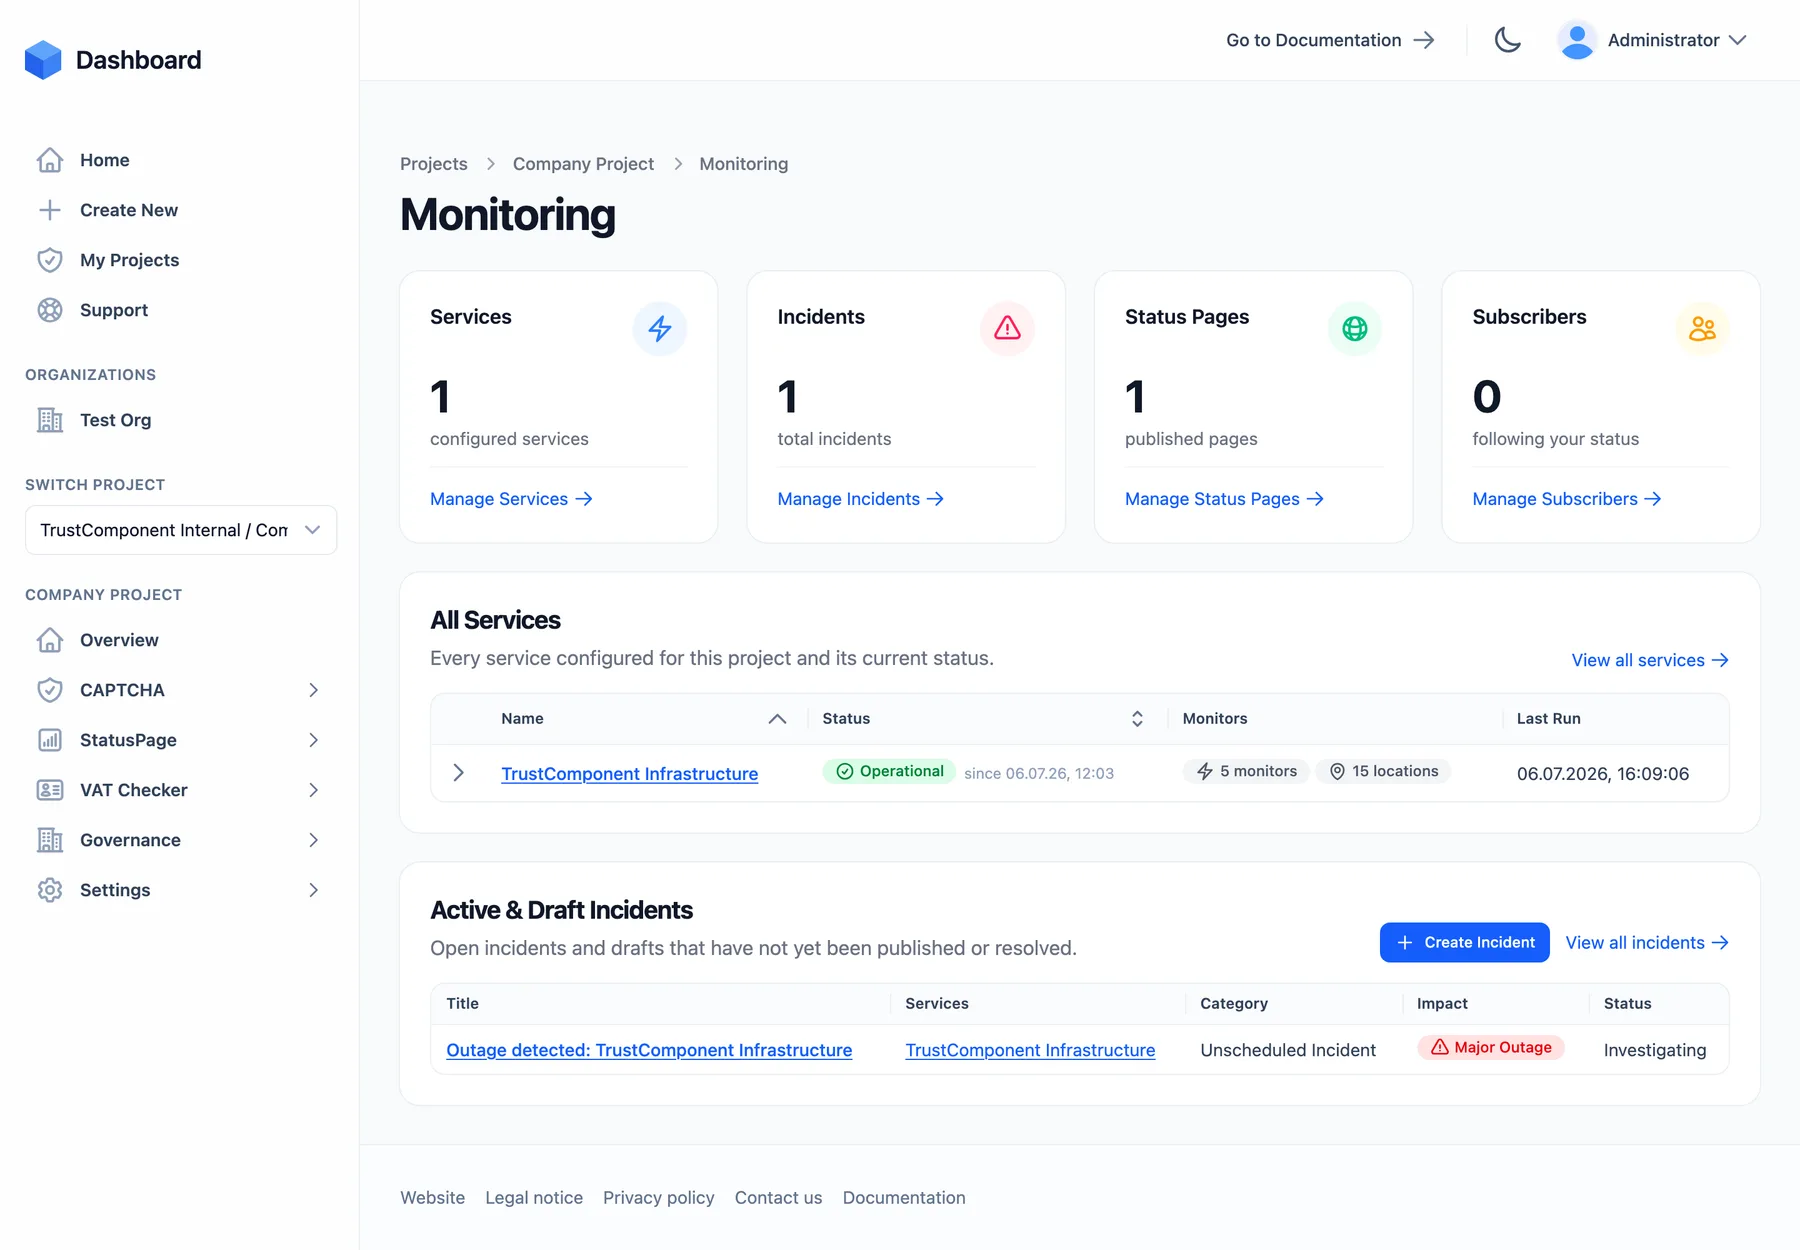
TrustComponent Monitoring watches your systems, alerts you the moment something goes wrong, and lets you communicate status and incidents to your customers on a public status page.
What you can do
Section titled “What you can do”- Monitor endpoints and infrastructure with 16 check types — HTTP(S), TCP, PING, DNS, TLS certificates, domain expiry, mail and other protocols, passive heartbeats, and page keywords — from up to three global locations (Germany, USA, Singapore), as often as every 15 seconds.
- Get alerted through 16 channel types (email, SMS, voice calls, Slack, Teams, Discord, PagerDuty, Opsgenie, webhooks, and more) with multi-step escalation, repeats, and one-click acknowledgement.
- Plan maintenance so expected downtime doesn’t page you or scare your customers.
- Manage incidents with a timeline, internal vs. public updates, attachments, and post-mortems.
- Publish status pages on your own domain, with your branding, showing exactly the services you choose.
- Notify subscribers automatically when status changes or incidents are posted.
- Report on uptime with on-demand and scheduled PDF reports.
Core concepts
Section titled “Core concepts”flowchart TD
SVC["Service
a system you monitor"]
MON["Monitors
individual checks / targets"]
LOC["Locations
where checks run from"]
MW["Maintenance Windows"]
RULE["Alert Rules
condition + escalation"]
CH["Alert Channels
where alerts go"]
INC["Incidents"]
SP["Status Pages"]
SUB["Subscribers"]
SVC --> MON
MON --> LOC
SVC --> MW
SVC --> RULE
RULE --> CH
SVC --> INC
SVC --> SP
SP --> SUB
INC --> SP- Service — a logical system you want to track (e.g. “Web API”, “Database”). A service rolls up the status of its monitors.
- Monitor — a single check with a target (an HTTP URL, a host and port, a domain, a heartbeat, …). Each monitor runs at an interval from one or more locations. See Services & Monitors.
- Alert Rule — a condition (e.g. “service goes to major outage”) plus an ordered escalation of notification steps. See Alerts & Escalation.
- Alert Channel — a destination for alerts (email, Slack, PagerDuty, webhook, …), shared across rules. See Alert Channels.
- Maintenance Window — a planned period where a service is expected down, so alerts and status are suppressed. Covered in Services & Monitors.
- Incident — a documented issue, with a public/internal timeline, that can be shown on your status pages. See Incidents.
- Status Page — a public dashboard of chosen services and incidents, with your branding and domain. See Status Pages.
- Subscriber — someone who opts in to updates from a status page. See Subscribers.
Getting started
Section titled “Getting started”Monitoring is a module inside a project — add it when you create a project or later under Settings › Modules & Add-ons. Then:
- Create a Service for the system you want to watch.
- Add one or more Monitors to it, choosing the check type, interval, and locations.
- Create an Alert Channel (e.g. your email or Slack) and an Alert Rule so you’re notified on outages.
- (Optional) Publish a Status Page and let customers subscribe to updates.
Services & Monitors Check types, locations, intervals, and maintenance windows.
Alert Channels Email, SMS, Slack, PagerDuty, webhooks, and more.
Alerts & Escalation Rules, escalation steps, acknowledgement, and history.
Incidents Document and communicate outages.
Status Pages Public status pages on your own domain.
Subscribers Let customers subscribe to status updates.
Reports On-demand and scheduled uptime reports.
Heartbeat API Push heartbeats from cron jobs and workers.

